
Advanced Analytics: Churn, Velocity & Engagement
Last updated: 2026-03-02
On This Page
Chapter Chronicles goes beyond basic views and comments. Our advanced analytics suite is built specifically for serial fiction — giving you early warning signals that generic platforms like Patreon simply cannot provide. These tools help you detect engagement problems before they show up as cancellations, so you can course-correct while you still have time.
Prerequisite: This guide covers advanced analytics features. If you're new to the analytics dashboard, start with Understanding Your Story Analytics for an overview of basic metrics, views trends, and chapter performance.
Engagement Alerts
The first thing you'll notice when engagement issues arise is the alert banner at the top of your analytics page. Alerts monitor your metrics automatically and flag concerning trends so you don't have to check your dashboard every day.
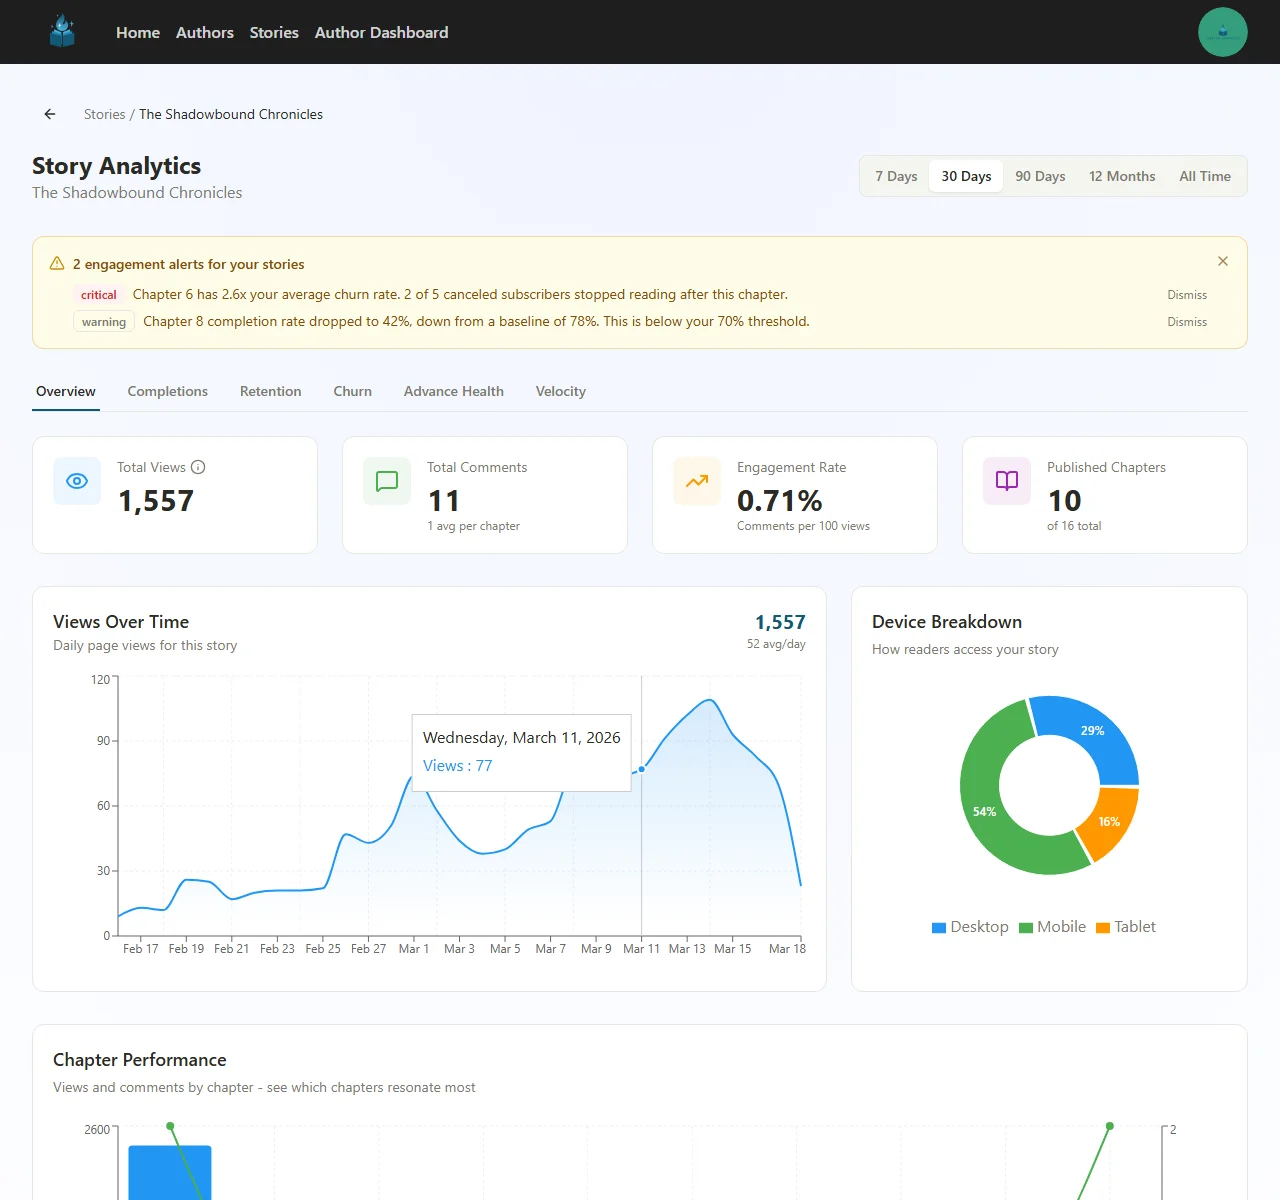
Alert types:
| Severity | What It Means | Example |
|---|---|---|
| Critical | A metric has crossed a dangerous threshold | "Chapter 6 has 2.6x your average churn rate" |
| Warning | A metric is trending in the wrong direction | "Chapter 8 completion rate dropped to 42%, down from a baseline of 78%" |
Each alert includes specific numbers and context so you can take action immediately. Click through to the relevant analytics tab, or dismiss alerts you've already addressed.
Tips:
- Don't panic at a single alert — look for patterns across multiple chapters
- Critical alerts about churn deserve immediate attention, since each cancellation represents lost recurring revenue
- Warning alerts are early signals — investigate them before they become critical
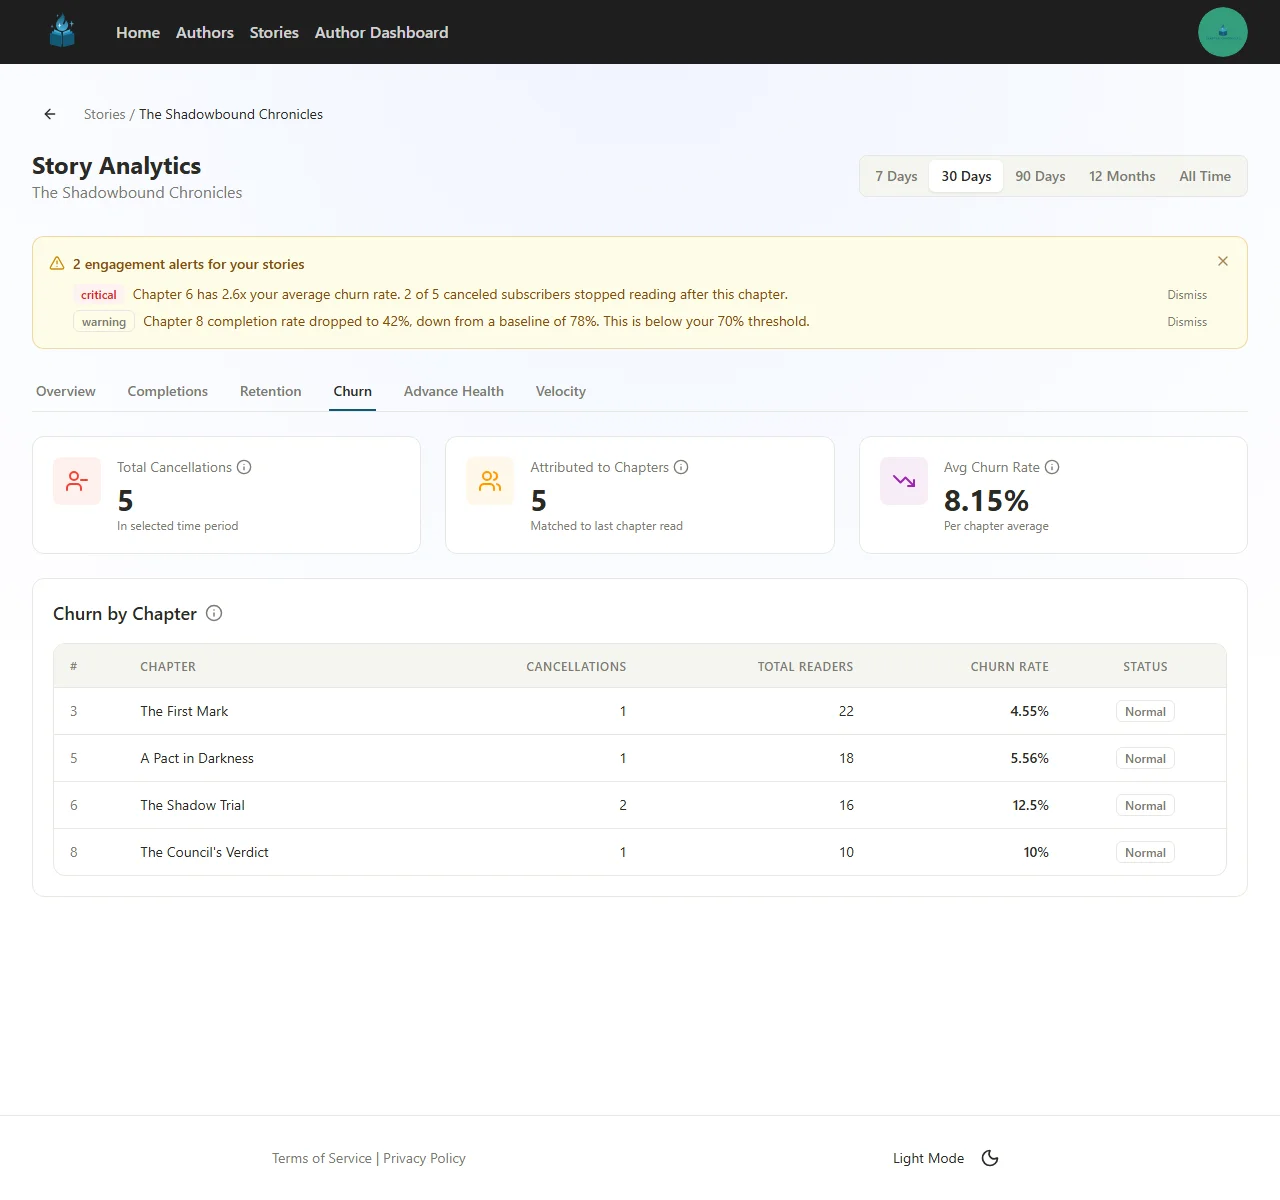
Churn Attribution
The Churn tab answers the most important question in subscription fiction: which chapters are causing subscribers to cancel?
When a subscriber cancels, Chapter Chronicles correlates the cancellation with the last chapter they read. This turns a vague "I lost a subscriber" into a specific, actionable insight: "Subscribers who read Chapter 6 cancel at 2.6x the average rate."
Summary Cards
| Card | What It Shows |
|---|---|
| Total Cancellations | Number of voluntary cancellations in the selected time period |
| Attributed to Chapters | How many of those cancellations could be matched to a specific last-read chapter |
| Avg Churn Rate | The average per-chapter churn rate across your story |
Churn by Chapter Table
The table breaks down cancellations by the last chapter each subscriber read before canceling. For each chapter, you'll see:
- Cancellations — How many subscribers canceled after reading this chapter
- Total Readers — How many subscribers read this chapter in the time period
- Churn Rate — Cancellations divided by total readers (percentage)
- Status — Normal, or flagged if the churn rate is significantly above your average
How to Use Churn Data
- Look for outliers — A chapter with 2x or higher churn rate compared to your average is a red flag
- Re-read flagged chapters — Common causes include pacing problems, unsatisfying resolutions, or jarring tone shifts
- Check the timing — Did a flagged chapter coincide with a long publication gap? Readers sometimes cancel during breaks, and the last chapter they read gets attributed
- Cross-reference with completion data — A chapter with high churn and low completion is a stronger signal than one with high churn but normal completion
Privacy note: Churn data is always aggregate. You'll never see which specific subscriber canceled — only the total count per chapter.
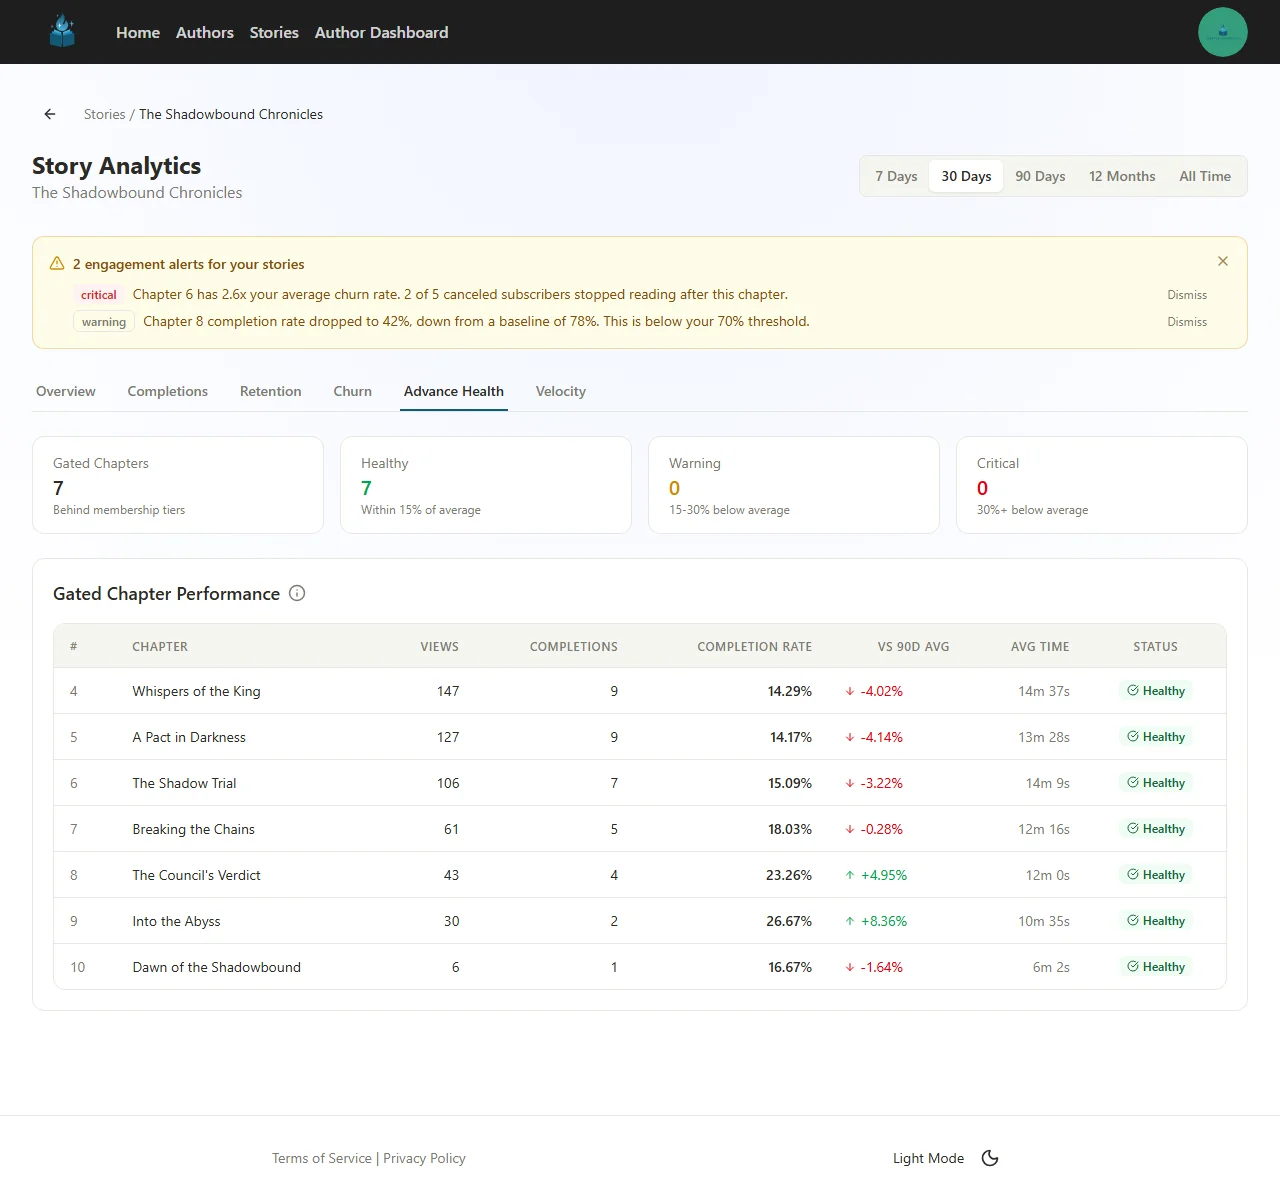
Advance Chapter Health
If you use the advance chapter model (subscribers read ahead of public chapters), the Advance Health tab is your early warning system for paid content quality.
The core problem it solves: chapters in your advance window have no public reviews, no Royal Road ratings, and no community feedback. Quality problems can build up silently across your entire buffer. This tab gives you real-time performance signals for the content your paying subscribers are reading right now.
Health Status Cards
| Card | What It Means |
|---|---|
| Gated Chapters | Total number of chapters behind membership tiers |
| Healthy | Chapters performing within 15% of your 90-day average |
| Warning | Chapters performing 15–30% below your average |
| Critical | Chapters performing 30%+ below your average |
Gated Chapter Performance Table
For each gated chapter, the table shows:
- Views and Completions — Raw engagement numbers
- Completion Rate — What percentage of readers who started the chapter finished it
- vs 90D Avg — How this chapter's completion rate compares to your trailing 90-day average, shown as a percentage with a directional arrow
- Avg Time — How long readers spend on the chapter
- Status — Healthy (green), Warning (yellow), or Critical (red)
What to Watch For
- Multiple Warning or Critical chapters in a row — This suggests a systemic issue, not just one weak chapter. Re-read the arc and look for pacing drift, unresolved tension, or exposition overload
- Declining completion rates on recent chapters — If your newest gated chapters are consistently below average, your current writing may be losing engagement
- Low average time on longer chapters — Readers may be skimming rather than engaging deeply, which often precedes cancellations
- All chapters Healthy — Great news. Your paid content is performing at or above your historical baseline
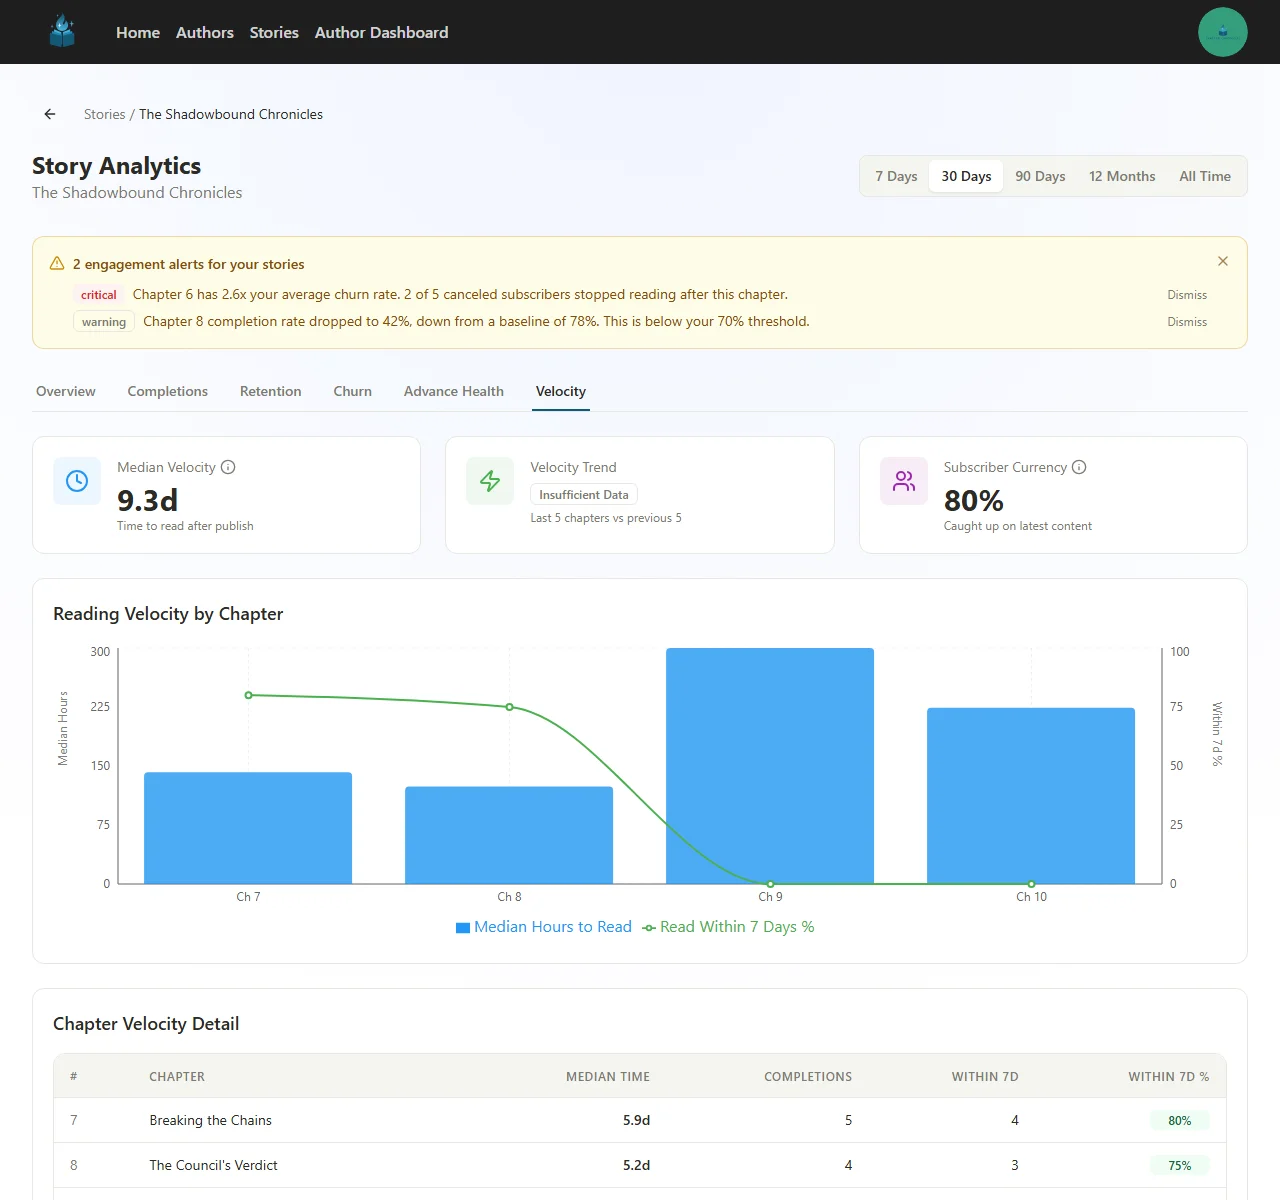
Reading Velocity
Completion rate tells you whether readers finished a chapter. Reading velocity tells you how quickly they got to it.
This distinction matters. A subscriber who reads your new chapter within hours of release is in a fundamentally different engagement state than one who takes a week to get around to it. Velocity slowdowns are a leading indicator — they show waning enthusiasm long before completion rates actually drop.
Summary Cards
| Card | What It Shows |
|---|---|
| Median Velocity | Median time between chapter publication and reader consumption, across all recent chapters |
| Velocity Trend | Whether velocity is speeding up or slowing down (compares last 5 chapters to the previous 5) |
| Subscriber Currency | What percentage of your active subscribers are caught up on your latest content |
Reading Velocity Chart
The combo chart shows two metrics side by side for each chapter:
- Blue bars — Median hours to read (left axis). Lower is better — it means subscribers are reading sooner after you publish
- Green line — Percentage of readers who read within 7 days (right axis). Higher is better
Chapter Velocity Detail
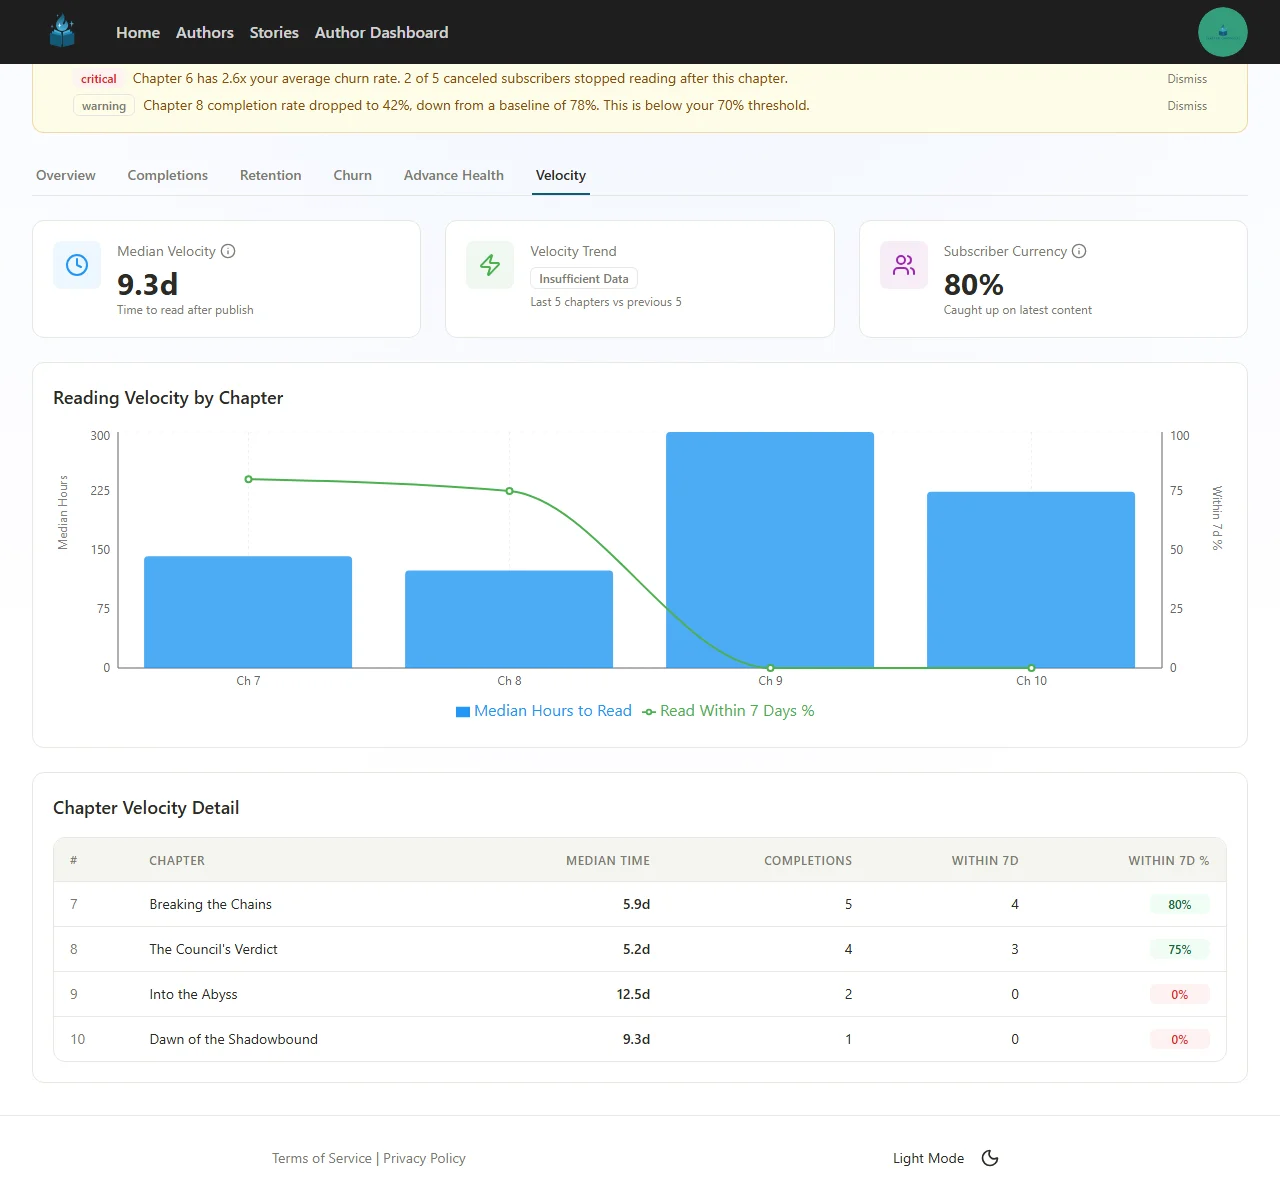
The detail table breaks down velocity per chapter:
- Median Time — Median days between publish and first read
- Completions — Total readers who finished the chapter
- Within 7d — How many read within a week of publication
- Within 7d % — The percentage that read within a week (green means healthy)
Reading the Signals
- Median velocity increasing over time — Readers are taking longer to get to new chapters. This is an early warning of declining interest
- Subscriber Currency dropping below 70% — A significant portion of your subscribers are falling behind. Consider whether your release pace is sustainable, or if recent content has been less compelling
- Within 7d % declining — Even if readers eventually finish chapters, a drop in urgency suggests the story may be losing its pull
- Velocity spikes on specific chapters — If one chapter took much longer to read than its neighbors, check if it was released during a holiday, or if the preceding chapter lacked a strong hook
Subscriber Engagement Scoring
While the Churn tab shows you what already happened, Engagement Scoring shows you what's about to happen. Every active subscriber is automatically scored based on their reading behavior, giving you a real-time view of your audience's health.
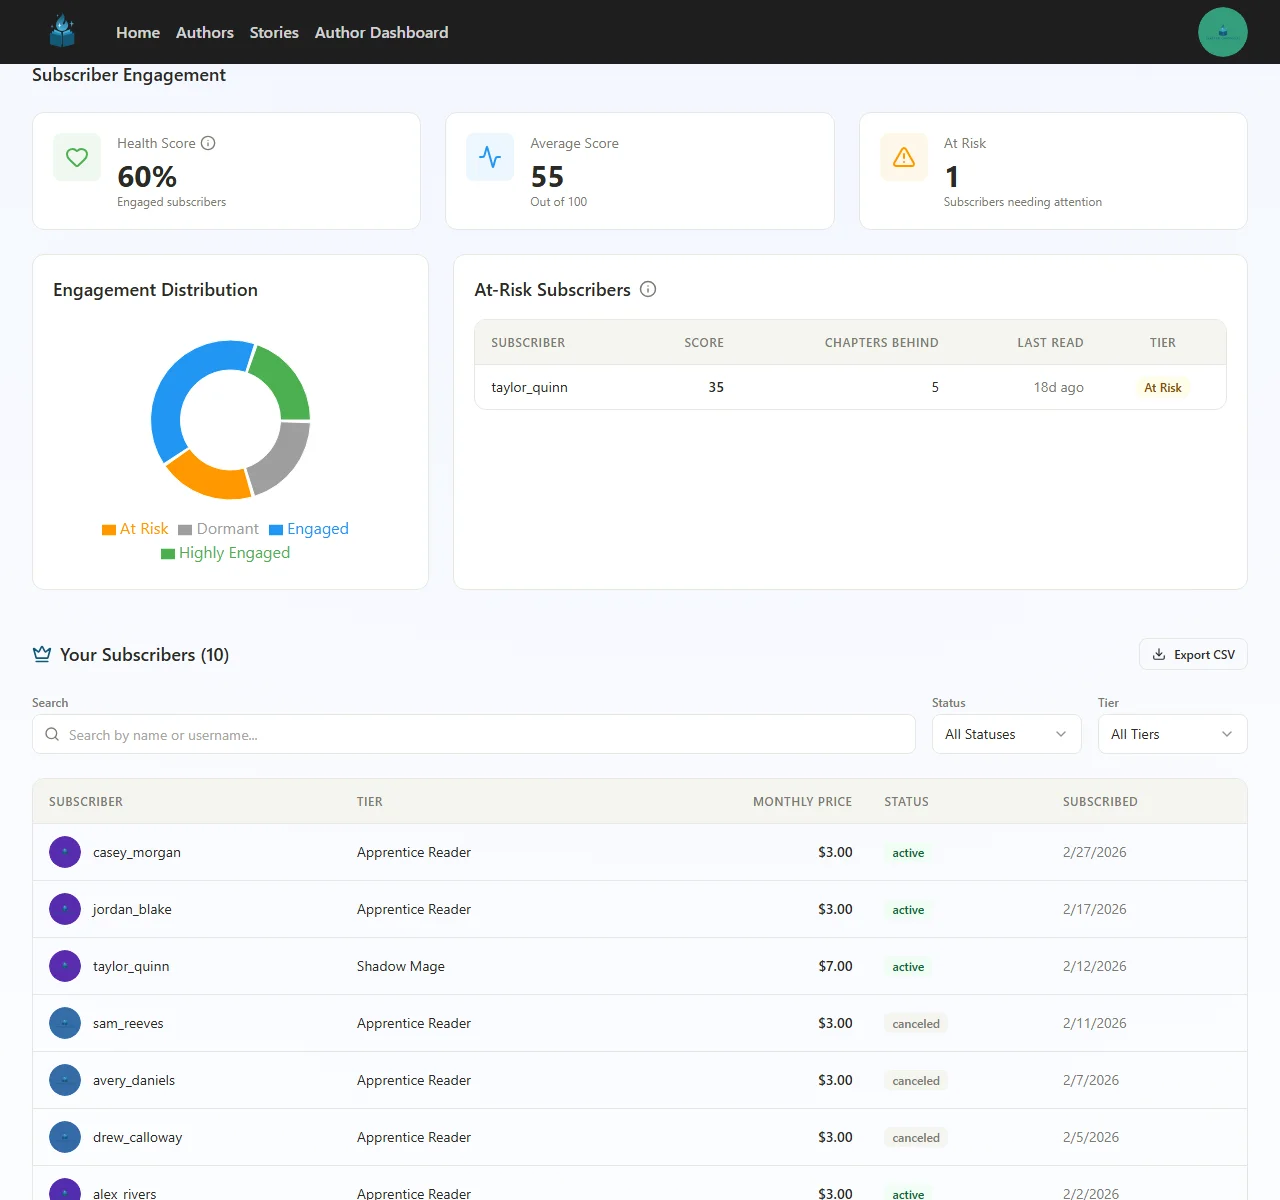
Engagement Summary
| Card | What It Shows |
|---|---|
| Health Score | Percentage of your subscribers who are actively engaged |
| Average Score | Mean engagement score across all subscribers (0–100 scale) |
| At Risk | Number of subscribers showing warning signs of potential churn |
Engagement Distribution
The donut chart shows how your subscriber base breaks down across four tiers:
| Tier | What It Means |
|---|---|
| Highly Engaged (green) | Reading chapters quickly, staying current, completing consistently |
| Engaged (blue) | Active but may lag slightly behind your latest releases |
| At Risk (orange) | Falling behind, haven't read recently, or showing declining engagement patterns |
| Dormant (gray) | No reading activity in an extended period |
At-Risk Subscribers Table
For subscribers flagged as At Risk, you'll see:
- Score — Their individual engagement score (lower = more concerning)
- Chapters Behind — How many chapters they haven't read yet
- Last Read — How long ago they last read a chapter
- Tier — Their membership tier
Subscriber Management
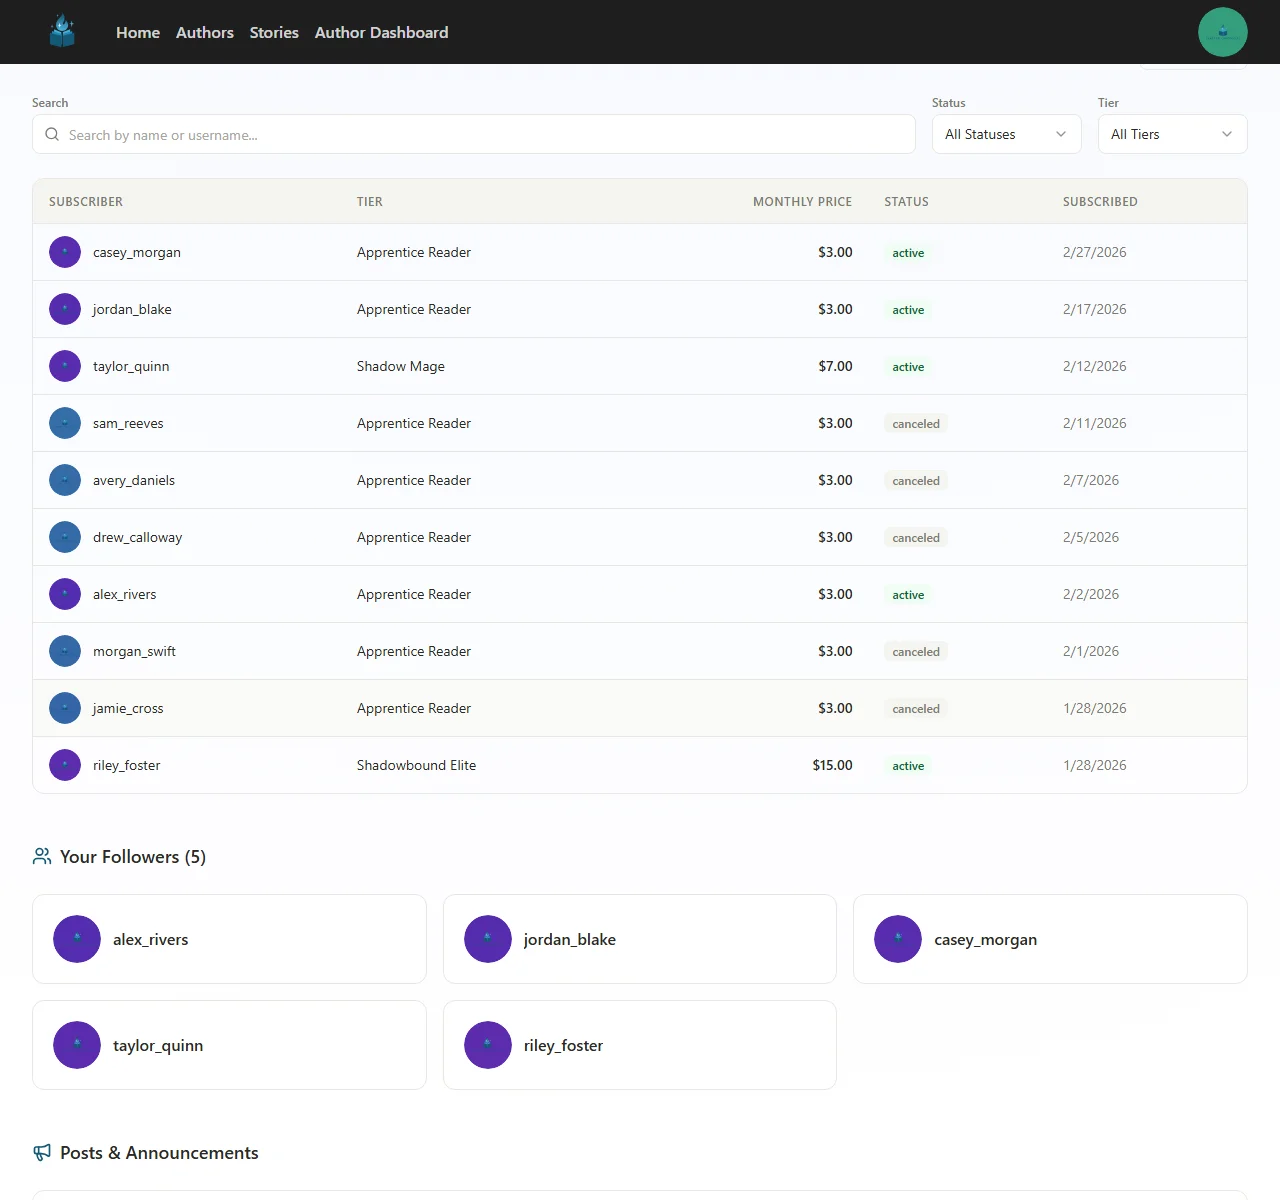
Below the engagement analytics, you'll find your full subscriber list with:
- Search — Find specific subscribers by name or username
- Filters — Filter by status (active, canceled) or membership tier
- Export — Download your subscriber list as CSV for external analysis
- Subscriber details — Each row shows the subscriber's tier, monthly price, status, and subscription date
Acting on Engagement Data
You can't (and shouldn't) message individual at-risk subscribers. But engagement data helps you take meaningful action:
- Publish a newsfeed post — If at-risk subscribers are multiple chapters behind, a post like "Catching up? Here's where we left off..." can re-engage lapsed readers
- Evaluate your pacing — If at-risk counts are climbing, your recent chapters may need stronger hooks or better cliffhangers
- Check your release schedule — A sudden spike in at-risk subscribers after a publication gap is normal. A gradual climb during consistent publishing is a content signal
- Monitor the trend — A rising Health Score means your story is gaining momentum. A falling one means it's time to investigate
Putting It All Together
These analytics work best when used together. Here's a recommended workflow:
Weekly Check (2 minutes)
- Glance at the alert banner — any critical or warning alerts?
- Check Subscriber Currency on the Velocity tab — are your readers keeping up?
- Look at the Health Score on Engagement — is the trend stable or declining?
Monthly Deep Dive (15 minutes)
- Review the Churn tab for the last 30 days — any chapters with above-average churn?
- Check Advance Health — are your paid chapters performing at or above your baseline?
- Look at the Velocity trend — are readers consuming chapters faster or slower than last month?
- Review the At-Risk subscriber count — is it growing or shrinking?
- Cross-reference: if churn, velocity, and engagement all point to the same chapters, those chapters need your attention
When Something Looks Wrong
- Start with the Churn tab to see if specific chapters correlate with cancellations
- Check those chapters on the Advance Health tab for completion rate drops
- Look at Velocity to see if the slowdown started before or after those chapters
- Use the Engagement distribution to understand the scale — is it a few subscribers or a broad trend?
What's Next?
- New to analytics? Start with Understanding Your Story Analytics for the basics
- Not monetizing yet? Set up billing to start earning from your story
- Want to gate chapters? Create tiers and manage access
Have questions about your analytics? Reach out to us at support@chapterchronicles.com — we're here to help you succeed.
Frequently Asked Questions
What is churn attribution and how does it work?
What does the Advance Chapter Health dashboard show?
How is reading velocity different from completion rate?
What do the subscriber engagement scoring tiers mean?
How do engagement alerts work?
Ready to Start Publishing?
Join authors building their creative business on Chapter Chronicles. Free to start, simple pricing when you earn.
Sign Up Free