
Understanding Your Story Analytics
Last updated: 2026-02-14
On This Page
Chapter Chronicles provides detailed analytics for every story you publish. Unlike generic platforms, our analytics are built specifically for serial fiction — giving you insights into reader behavior, chapter performance, and engagement patterns that help you write better stories and grow your audience.
Accessing Analytics
There are two ways to access your story analytics:
- From the Author Dashboard — Go to the Stories tab, find your story, and click the analytics icon
- From the Performance tab — The Performance tab shows high-level metrics across all your stories, with the option to drill into individual story analytics
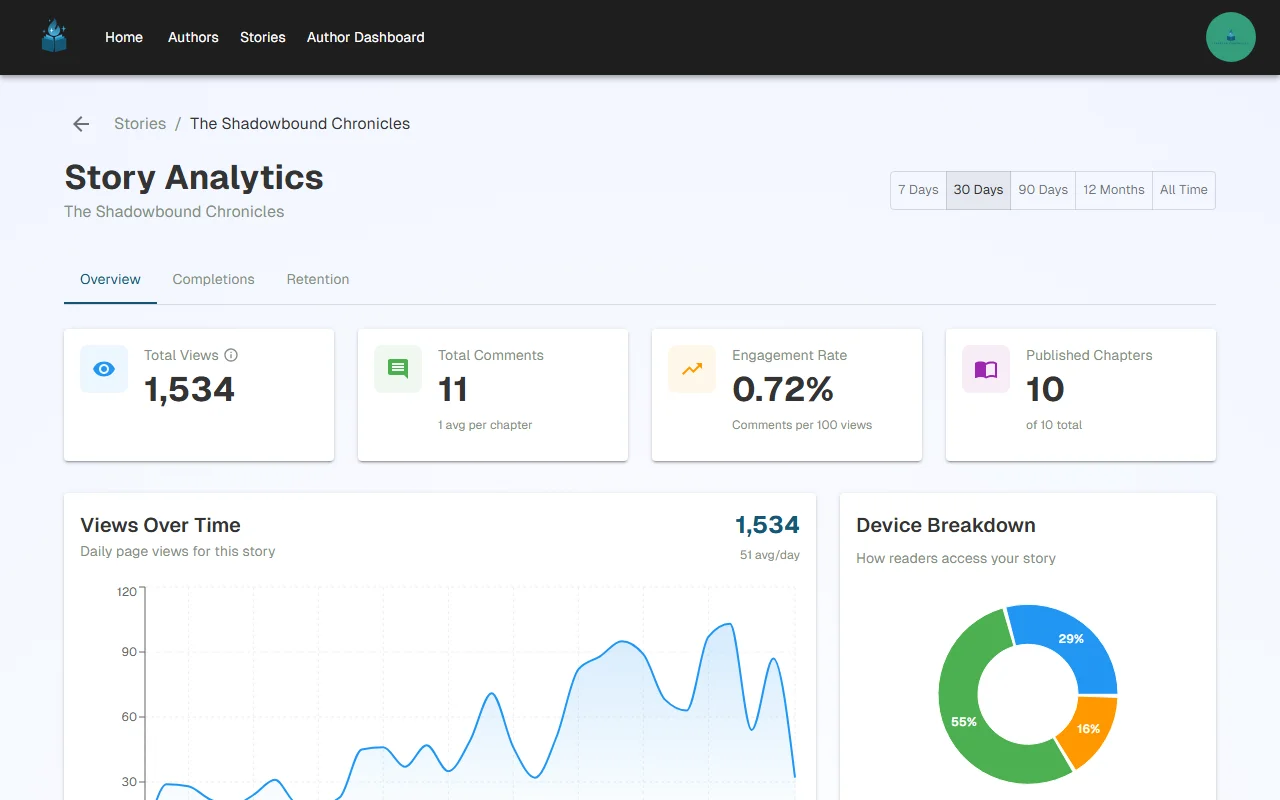
Overview Metrics
At the top of the analytics page, you'll see four key metrics:
| Metric | What It Means |
|---|---|
| Total Views | The total number of page views across all chapters in this story |
| Total Comments | How many comments readers have left on your chapters |
| Engagement Rate | Comments per 100 views — measures how actively your readers engage |
| Published Chapters | How many chapters are published vs. total (including drafts) |
What's a Good Engagement Rate?
- 1-2% — Average for most fiction
- 3-5% — Strong engagement, your readers are invested
- 5%+ — Excellent, you have a very active and passionate audience
Time Period Selection
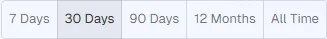
All analytics can be filtered by time period:
- 7 Days — See recent trends and the impact of your latest chapter release
- 30 Days — The most useful view for understanding month-over-month performance
- 90 Days — Identify seasonal patterns and longer-term trends
- 12 Months — Year-in-review perspective
- All Time — Your complete performance history
Charts and metrics automatically update when you change the time period.
Views Trend
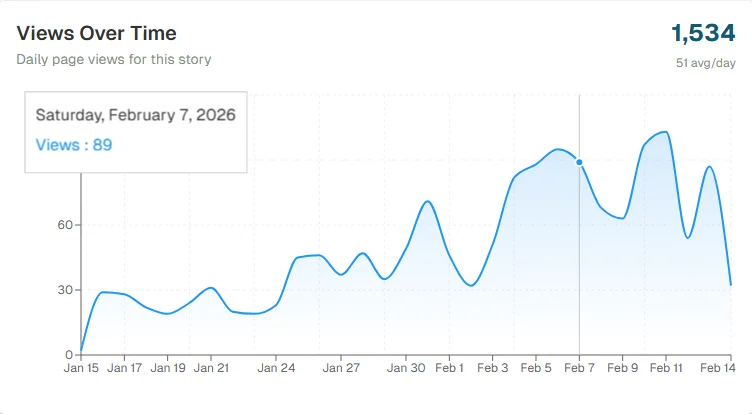
The Views Trend chart shows daily view counts over your selected time period. This is your most important growth metric.
How to read it:
- Spikes usually correspond to new chapter releases — track which days get the most views
- Sustained high traffic means your story has organic discovery (search, recommendations, shares)
- Declining traffic may mean you need to publish more frequently or promote your story
Tips:
- Publish on the same day(s) each week so readers know when to expect new content
- Look for your best-performing days and schedule releases accordingly
- A spike after a new chapter is normal — the key metric is whether your baseline traffic is growing
Chapter Performance Breakdown
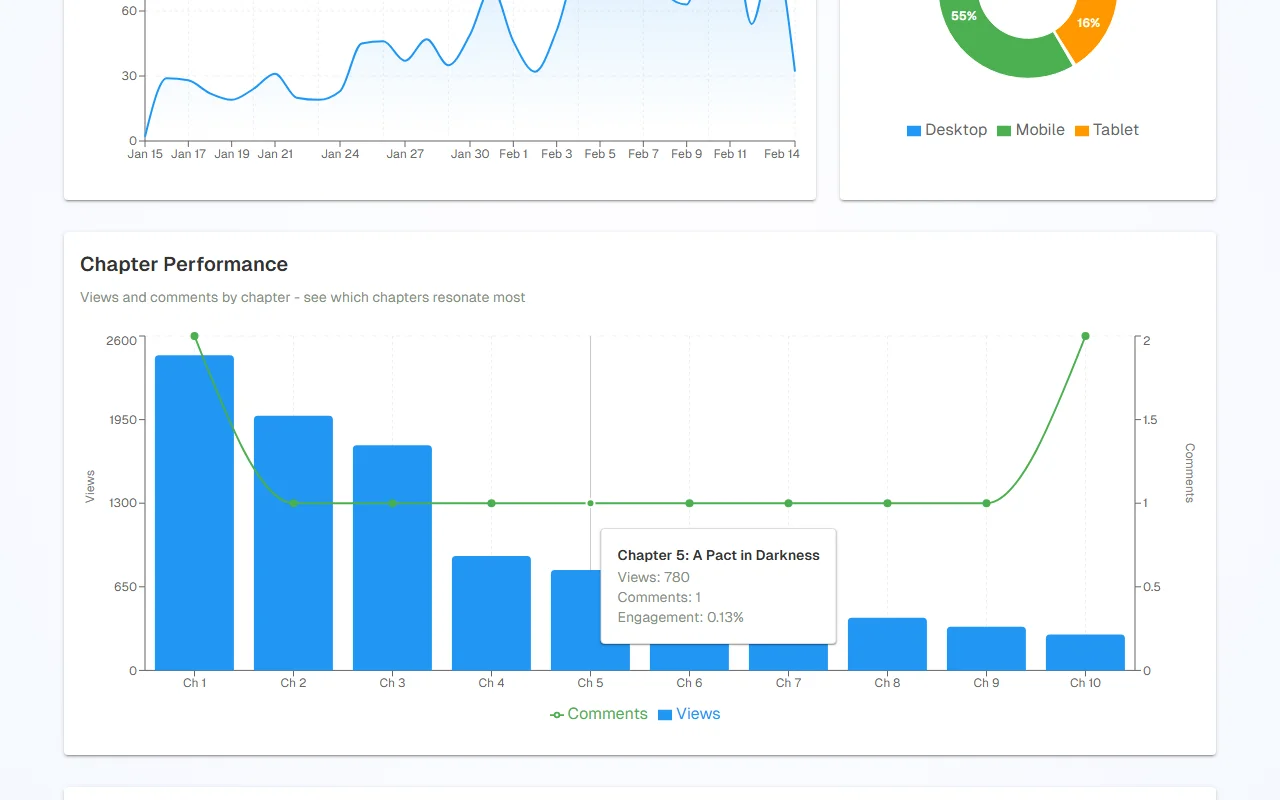
The Chapter Performance chart is one of the most important tools for understanding where readers drop off in your story. It compares views across all your published chapters, giving you a clear picture of your story's retention curve.
How to read it:
- Chapter 1 always has the most views — This is expected, as it's the entry point for all readers
- Gradual decline is normal — not every reader finishes every story. A healthy retention curve shows a gentle slope downward
- Sharp drop-offs are critical signals — if chapter 5 has 1,000 views but chapter 6 has only 100, something about chapter 5 (or the transition to chapter 6) is losing readers. This is where you should focus your editing efforts
- Flat sections (similar views across multiple chapters) mean readers who reach that point tend to continue — these are your story's "sticky" zones
Identifying Drop-Off Points
Drop-off analysis is crucial for serial fiction. Common patterns to watch for:
- Early drop-off (chapters 1-3) — Your hook isn't strong enough. Readers are trying your story but not getting invested. Strengthen your opening conflict and character introductions
- Mid-story drop-off — Pacing issues. Look for chapters that are heavy on exposition or lack tension. Every chapter needs a reason for readers to click "next"
- Free-to-gated boundary drop-off — If you see a steep cliff at the transition from free to gated chapters, your free preview may not be hooking readers deeply enough. Consider extending it by one or two chapters
- Late-story drop-off — Less common but can indicate meandering plot or delayed payoffs. Ensure your story arcs are progressing
Tips for Improving Retention
- Compare your highest-viewed chapters to your lowest — what's different about the hooks, cliffhangers, or pacing?
- Your most-viewed chapters after chapter 1 are your strongest — study what makes them compelling
- End every chapter on a moment of tension, revelation, or emotional peak
- If there's a sharp drop-off at the free/gated boundary, consider extending your free preview by a chapter or two
- Review chapters with the biggest drops — even small edits to pacing or cliffhangers can dramatically improve retention
AI Insights on Engagement (Coming Soon)
We're building AI-powered engagement insights that will automatically analyze your story's performance and provide personalized recommendations. Here's what's coming:
- Automated drop-off analysis — AI will identify your biggest reader drop-off points and suggest specific improvements based on chapter content
- Optimal release scheduling — Recommendations for the best days and times to publish based on your audience's reading patterns
- Content pattern recognition — Understand which writing patterns (cliffhangers, character reveals, action sequences) correlate with higher engagement in your stories
- Audience growth predictions — Forecasts based on your current trajectory and publishing cadence
Your Data, Your Choice: All AI features will be opt-in — they will be disabled by default and can be enabled individually through your account settings. We will never send your engagement data or chapter content to a third-party data processor without your explicit consent. Any data processors we work with will have agreements prohibiting them from using your data for model training or any purpose beyond providing the service to you. Full details on data handling, processor agreements, and your rights will be outlined in our Terms of Service.
Stay tuned — we'll announce this feature in our blog and newsfeed when it launches.
Using Analytics to Grow
Track Your Publishing Impact
After each new chapter release:
- Check the Views Trend for a spike on release day
- Compare the spike size to previous releases
- If spikes are growing, your audience is expanding
- If spikes are shrinking, consider promotion or engagement strategies
Identify Your Best Content
Use Chapter Performance to find your strongest chapters, then:
- Study what makes those chapters compelling (cliffhangers, reveals, character moments)
- Apply those techniques to future chapters
- Consider promoting those chapters in your newsfeed or social media
Optimize Your Release Schedule
Using Views Trend data:
- Identify which days of the week get the most views
- Schedule new chapter releases on those high-traffic days
- Experiment with different release times and track the impact
Monitor Conversion Points
If you have gated chapters:
- Look at the view drop-off between your last free chapter and first gated chapter
- A healthy conversion keeps 20-30% of free readers
- If conversion is below 10%, your free preview may not be engaging enough — try extending it
What's Next?
- Not earning yet? Set up Stripe Connect to start receiving payments
- Want to monetize? Create tiers and gate chapters
- New to the platform? Learn how to become an author
Have questions about your analytics? Reach out to us at support@chapterchronicles.com — we're here to help you succeed.
Ready to Start Publishing?
Join authors building their creative business on Chapter Chronicles. Free to start, simple pricing when you earn.
Sign Up Free